Keep the conversation going
Ask a follow-up about an answer or explore one part of a broad topic in more detail.

For study, research and work
Ask a question. Get a clear explanation and explore its sources.
Ask a questionFree access · Sign in with Telegram
See what you can do OpenSI
The arithmetic mean and the median are two of the most commonly used measures of the centre of data: ways of describing its location. To calculate the arithmetic mean, add all the values and divide the sum by the number of values.
Excerpt from the source · original language
The "center" of a data set is also a way of describing location. The two most widely used measures of the "center" of the data are the mean (average) and the median.
To calculate the mean weight of 50 people, add the 50 weights together and divide by 50. Technically this is the arithmetic mean.
We will discuss the geometric mean later. To find the median weight of the 50 people, order the data and find the number that splits the data into two equal parts meaning an equal number of observations on each side.Read original ↗
To find the median, order the data and identify the number that divides it into two parts with equal numbers of observations.
For an odd number of observations, the median is the middle value in the ordered data. For an even number, add the two middle values and divide by two. The median usually describes the centre better when the data contains extreme values or outliers, because it is not affected by the outliers’ precise numerical values.
Excerpt from the source · original language
If n is an odd number, the median is the middle value of the ordered data (ordered smallest to largest). If n is an even number, the median is equal to the two middle values added together and divided by two after the data has been ordered.
The weight of 25 people are below this weight and 25 people are heavier than this weight. The median is generally a better measure of the center when there are extreme values or outliers because it is not affected by the precise numerical values of the outliers.Read original ↗
OpenSIIn young people, femoral shaft fractures most often result from high-energy collisions, particularly car or motorcycle crashes. In older people with weakened bones, such as those with osteoporosis, a femoral shaft fracture can occur after a fall from standing height.
Excerpt from the source · original language
Femoral shaft fractures in young people are frequently due to some type of high-energy collision.
The most common cause of femoral shaft fracture is a motor vehicle or motorcycle crash.
A lower-force incident, such as a fall from standing, may cause a femoral shaft fracture in an older person who has weaker bones, such as from osteoporosis.Read original ↗
Osteoporosis and osteopenia weaken bones and substantially increase fracture risk, particularly after falls.
Excerpt from the source · original language
People with osteoporosis or osteopenia are much more likely to experience broken bones, especially from falls.
Osteoporosis weakens your bones.Read original ↗
OpenSIData leakage occurs when a model uses information that would not be available at prediction time, inflating evaluation scores and harming performance on new data. To prevent leakage, split the data into training and test sets before preprocessing, and fit transformations only on training data.
Excerpt from the source · original language
Data leakage occurs when information that would not be available at prediction time is used when building the model. This results in overly optimistic performance estimates, for example from cross-validation, and thus poorer performance when the model is used on actually novel data, for example during production.
Although both train and test data subsets should receive the same preprocessing transformation (as described in the previous section), it is important that these transformations are only learnt from the training data. For example, if you have a normalization step where you divide by the average value, the average should be the average of the train subset, not the average of all the data.Read original ↗
TimeSeriesSplit divides time-ordered data so that training uses earlier observations and testing uses later ones, preventing the use of future information.
Excerpt from the source · original language
Provides train/test indices to split time-ordered data, where other cross-validation methods are inappropriate, as they would lead to training on future data and evaluating on past data.Read original ↗
Open a source below a paragraph to see the quotation.
A closer look
Explore the interface. Switch examples and enlarge any screenshot.
01 / 03
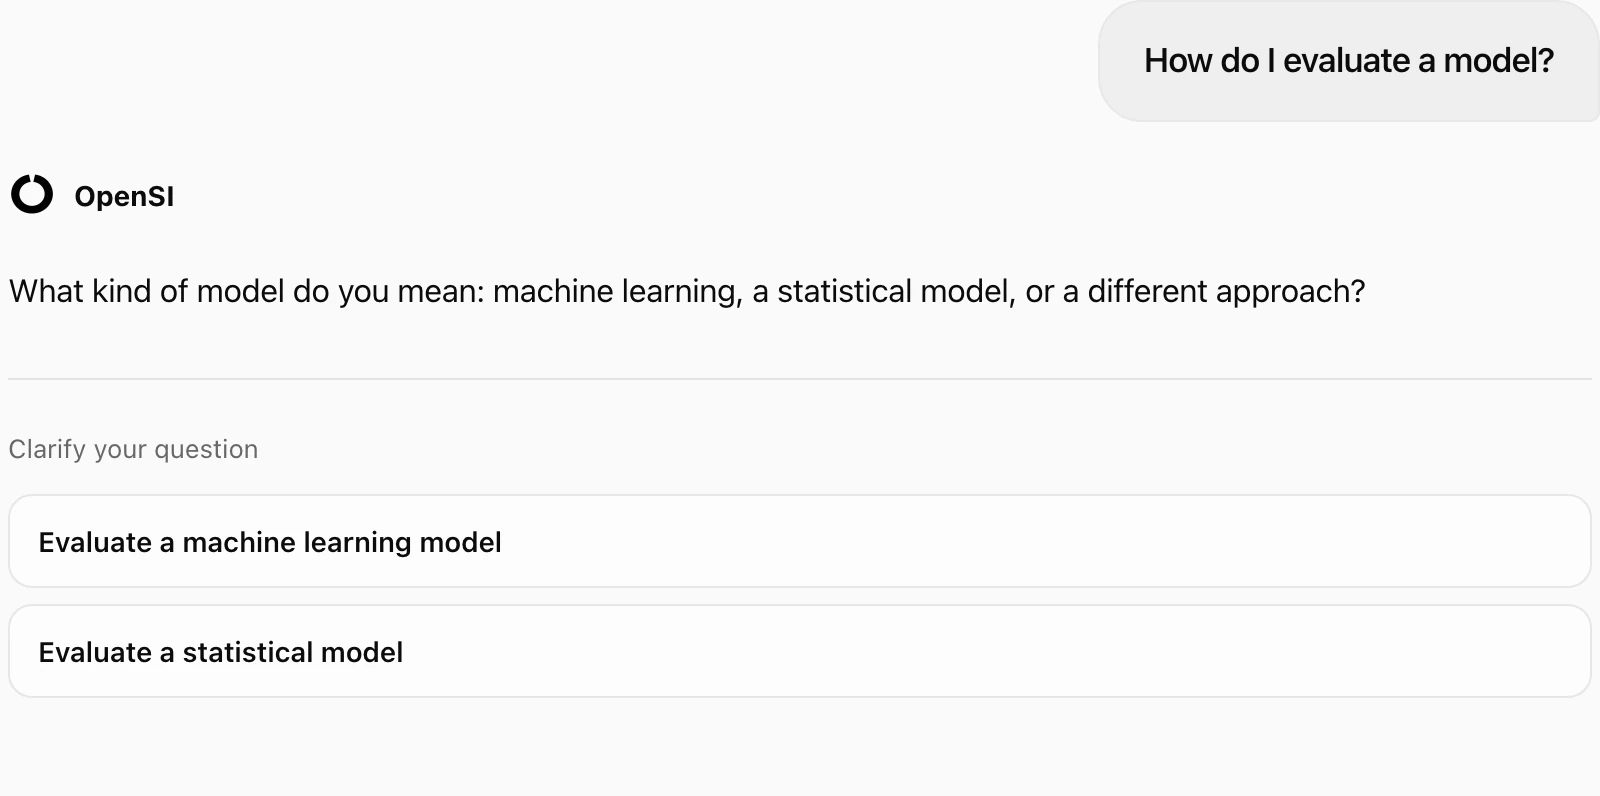
When a question is ambiguous, OpenSI can ask a follow-up and suggest ways to narrow it down.
Choose a direction, edit the question if needed, then send it when you are ready.
02 / 03
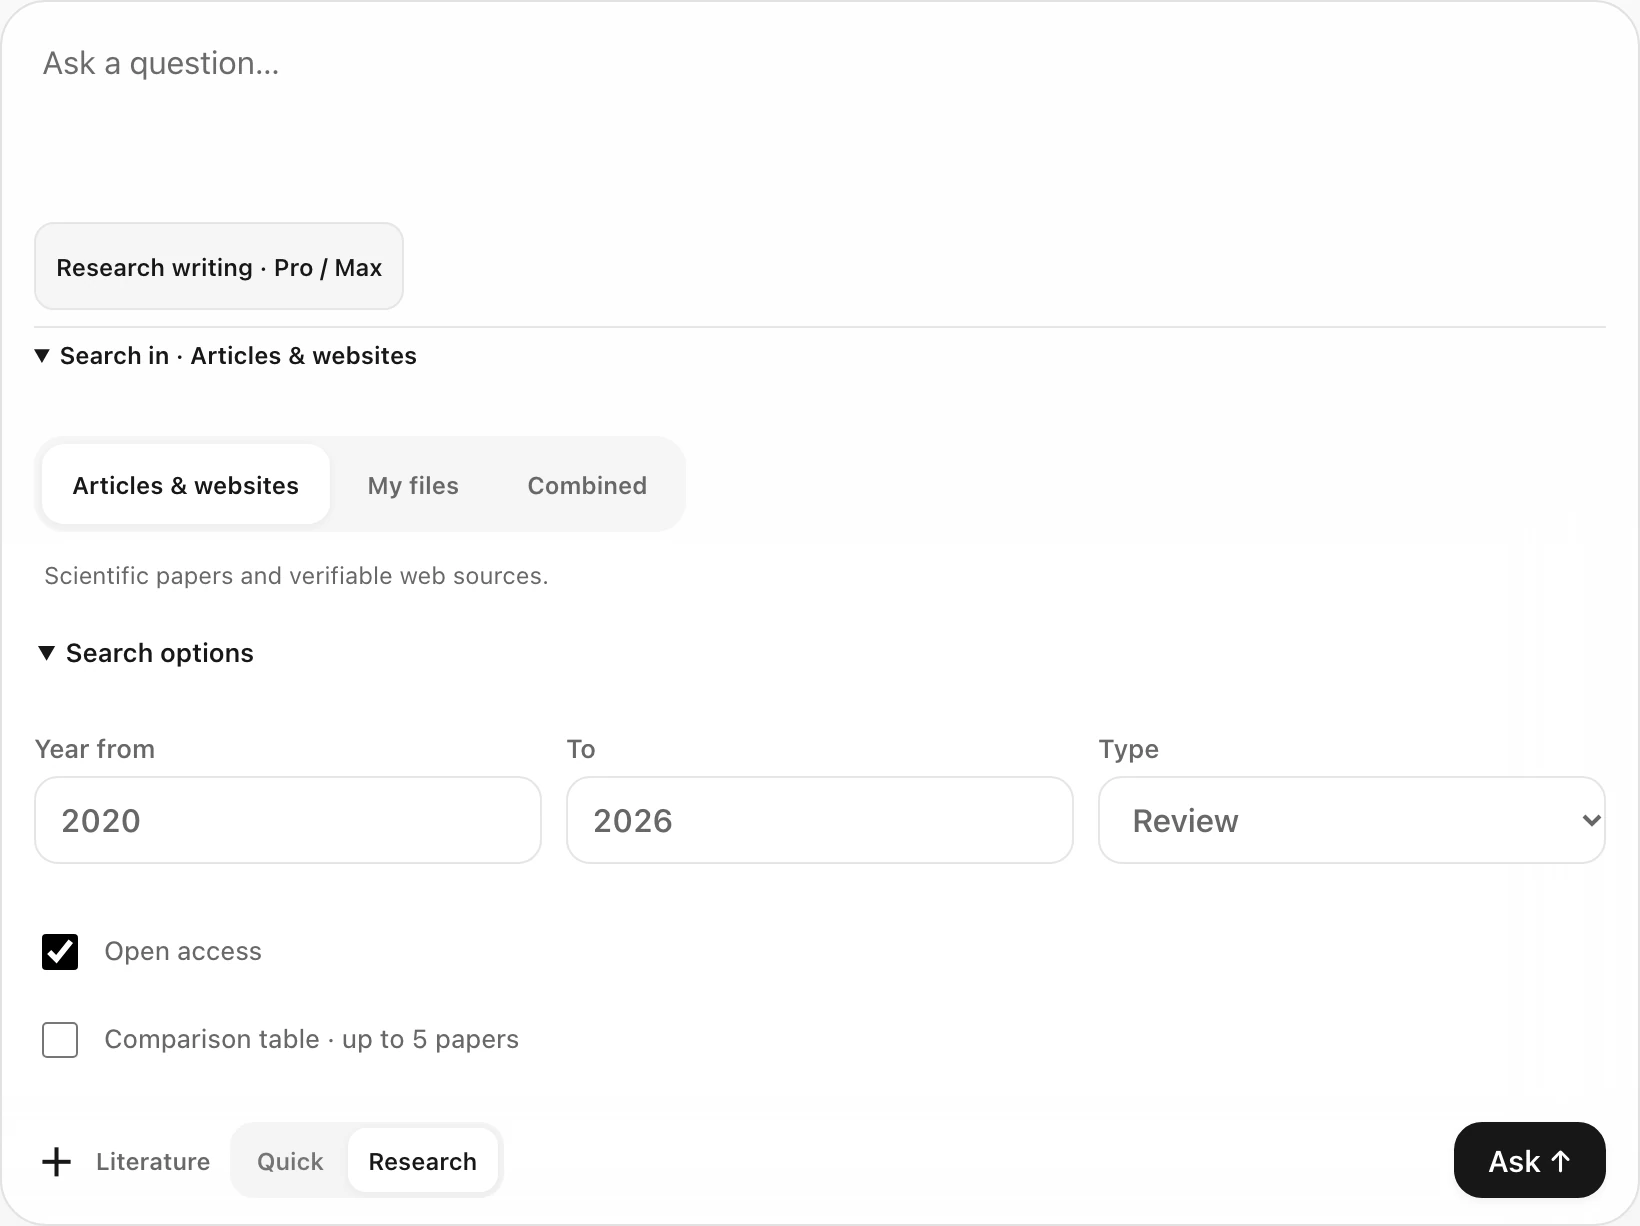
Search publications, your own library, or both. Narrow publications by year, type and open access.
For your library, choose a folder or specific files. Publication filters apply to the scientific catalogs.
03 / 03
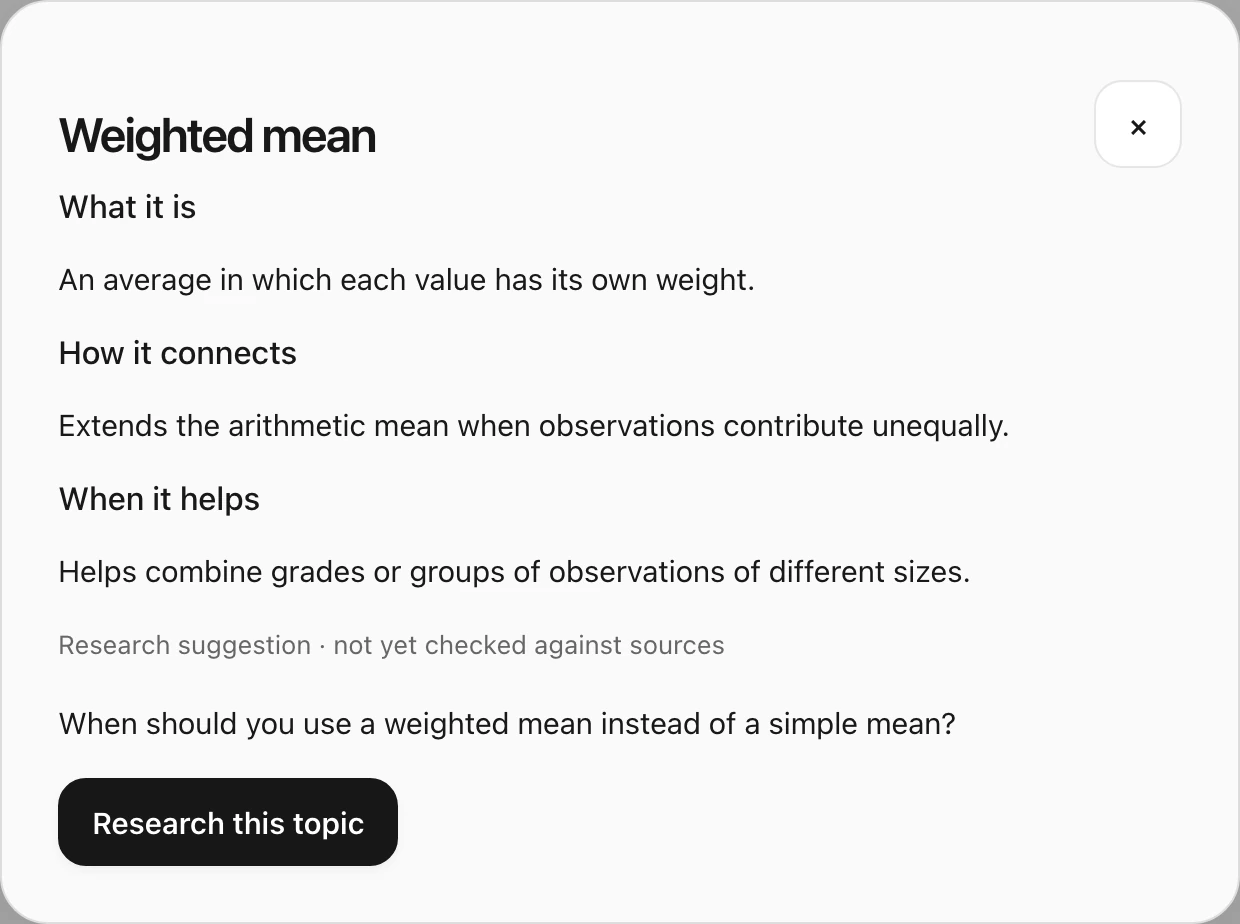
Discover concepts that help you explore the question further. Each topic explains what it means, how it connects and when it may help.
Open the topic first. A new source search starts when you choose “Research this topic”. Suggestions are starting points, not verified conclusions.
Self-check
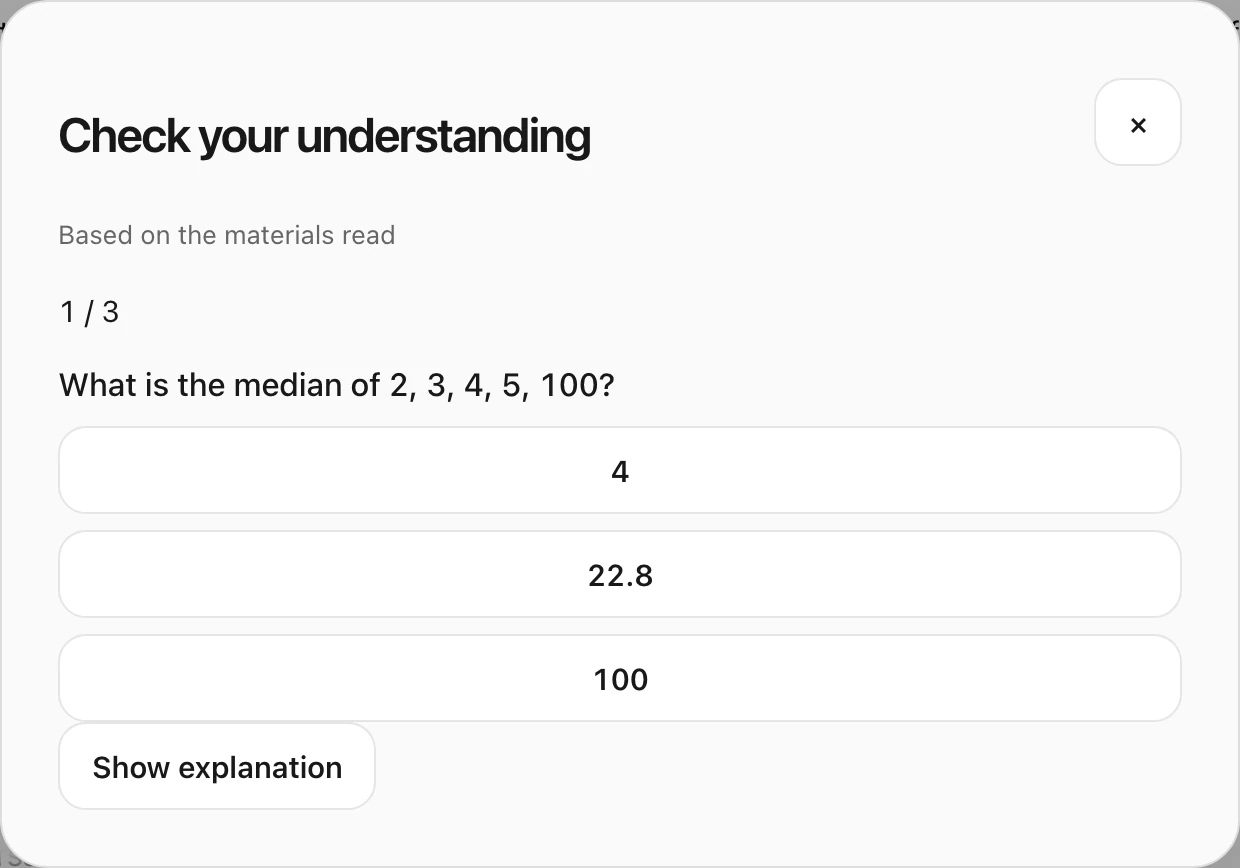
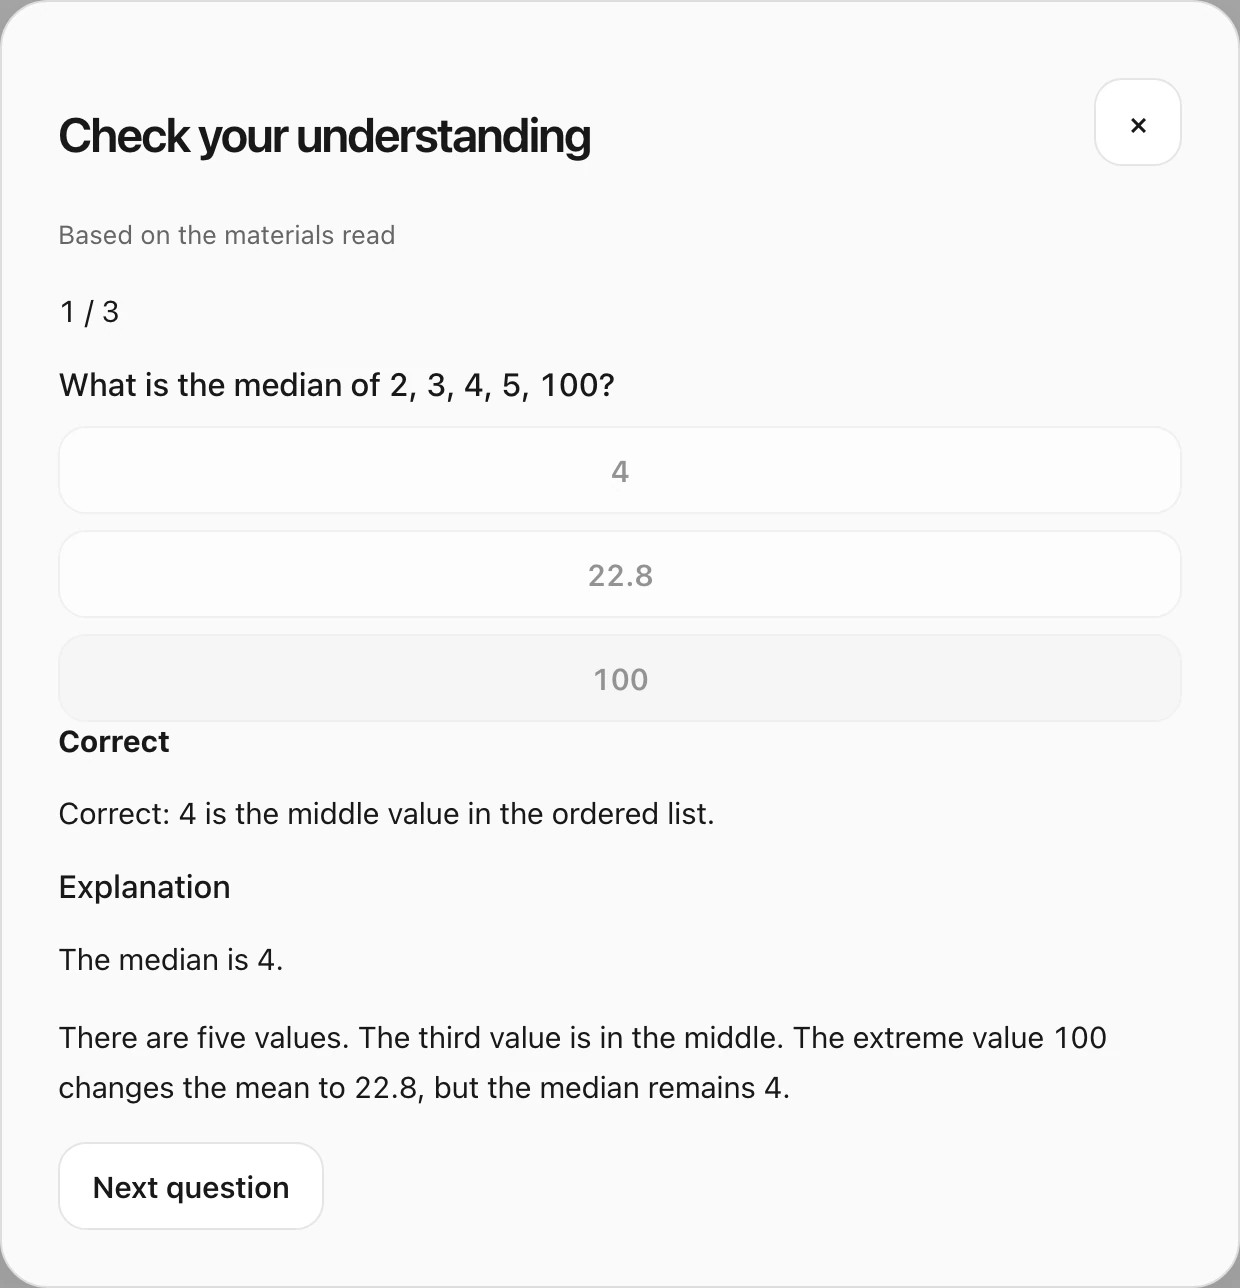
Choose an answer or explain it in your own words. OpenSI gives feedback and walks you through the explanation.
Available from an answer. Quick-mode exercises are marked as not checked against sources. Feedback may contain errors.
Learn together
Choose “Learn” before asking. OpenSI prepares the materials and starts with a small question. The full explanation stays behind a separate button.
Try the tutorUses your plan’s shared limits. AI feedback can contain errors.
Learning example · median
Try answering first, then open a hint.
What should you do with the order of the observations before finding the middle?
Order the values. For an odd number of observations, the median is the middle value; for an even number, it is the mean of the two middle values. Next, apply this to your own example.
In the app, the tutor checks your attempt and offers the next step.
Your library
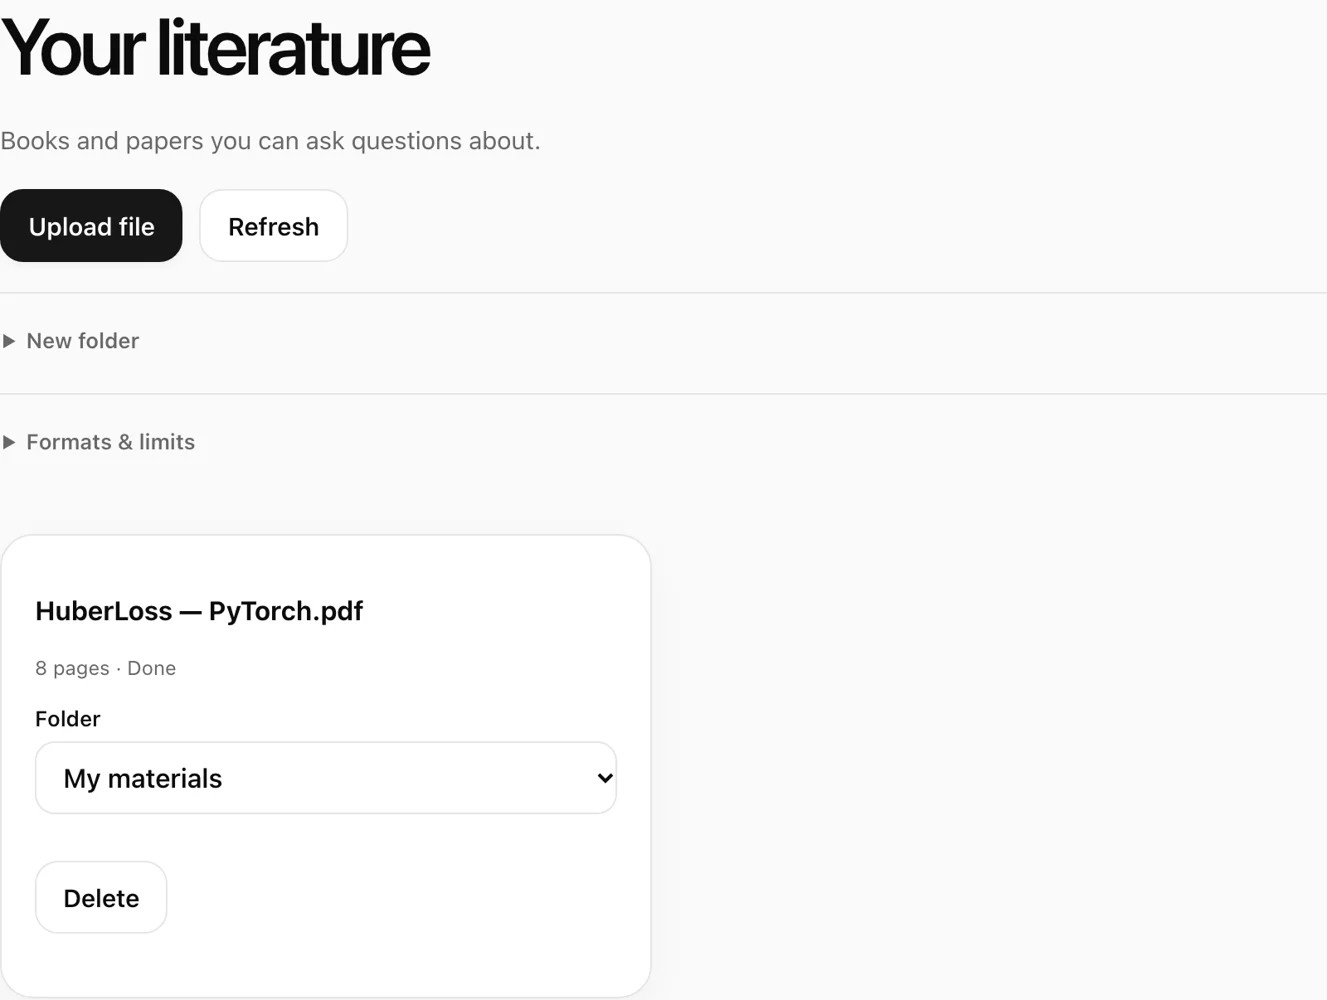
Upload a book or papers. Ask questions about your documents and open the passages behind the answer.
PDF · DOCX · EPUB · ODT · FB2 · TXT · MD
Ask a follow-up about an answer or explore one part of a broad topic in more detail.
Bring up to five works into a table with the comparison fields you choose.
Keep answers, copy text and references, or export results for further work.
Quick responds without a new source search. Research looks for materials to support the answer.
Pro / Max can help with a consultation plan: objectives, methods and structure. Available once every 30 days.
A research answer may include related YouTube videos. They are supplementary material, not evidence for scientific claims.
Access
Free usage limits are available on the web. Subscriptions with higher limits are available through Telegram.
Ask a questionSubscriptions in Telegram ↗Select “Ask a question”. To send your question and use your library, confirm sign-in through Telegram. The website does not ask for your password or phone number.
PDF, DOCX, ODT, EPUB, FB2, TXT and Markdown. Files can be up to 50 MB on the web, subject to account limits. Convert older DOC files to DOCX first.
No. Quick mode does not run a new search. If research finds insufficient material, a clearly labelled quick answer may be offered without source verification. Library-only answers stay within your selected documents. Even cited answers can contain errors.
Processing may involve external AI services. The server masks detected sensitive data, but the filter may miss some. Do not upload secrets or documents containing personal data. More about your data.